Education Growth Concept Template
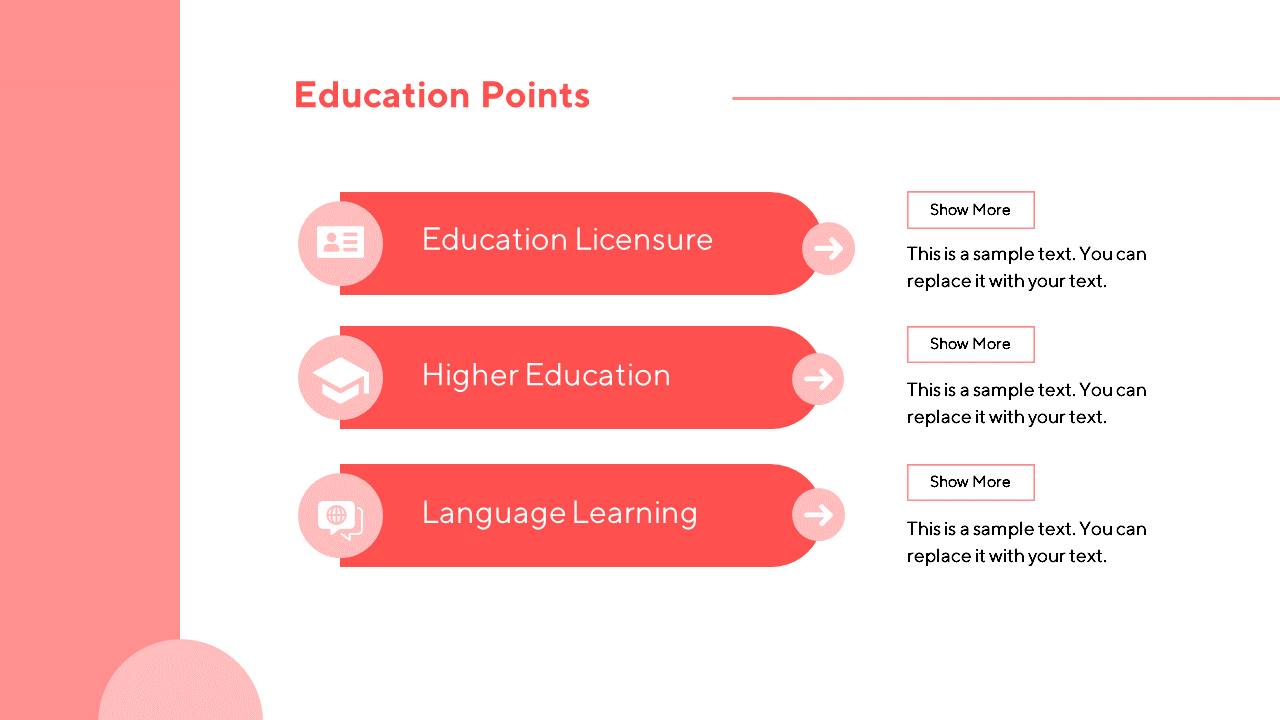
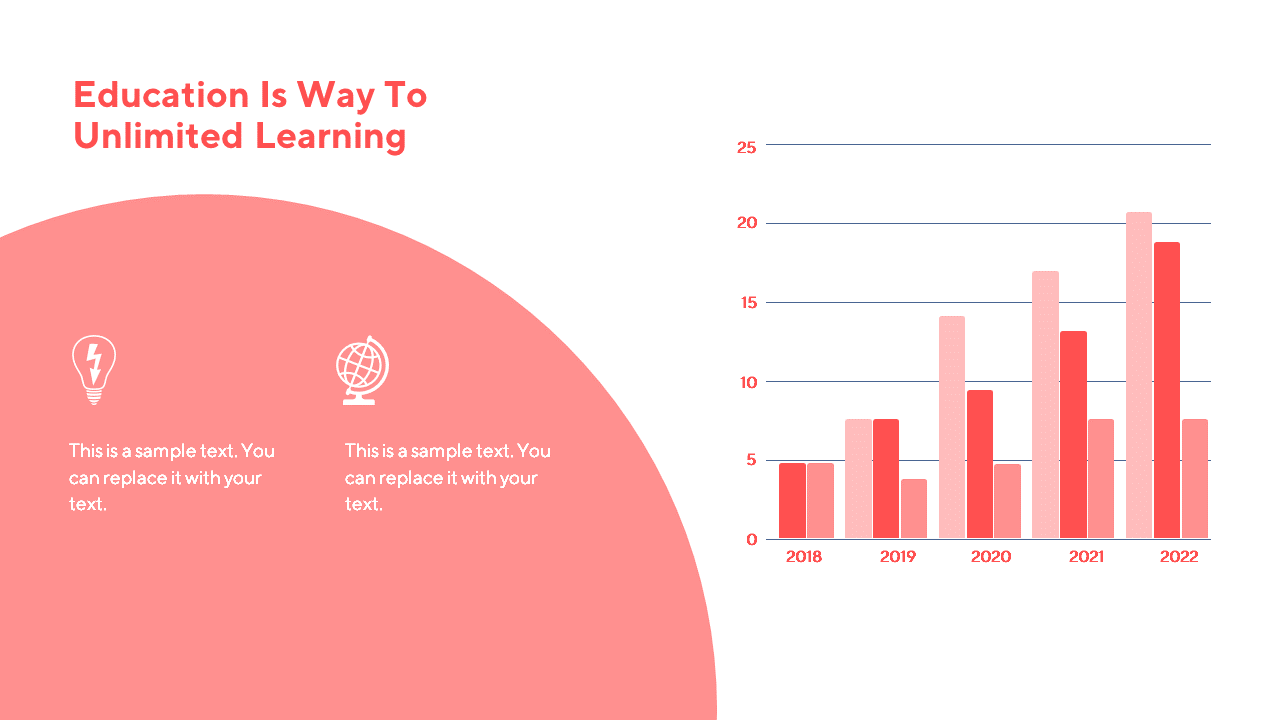
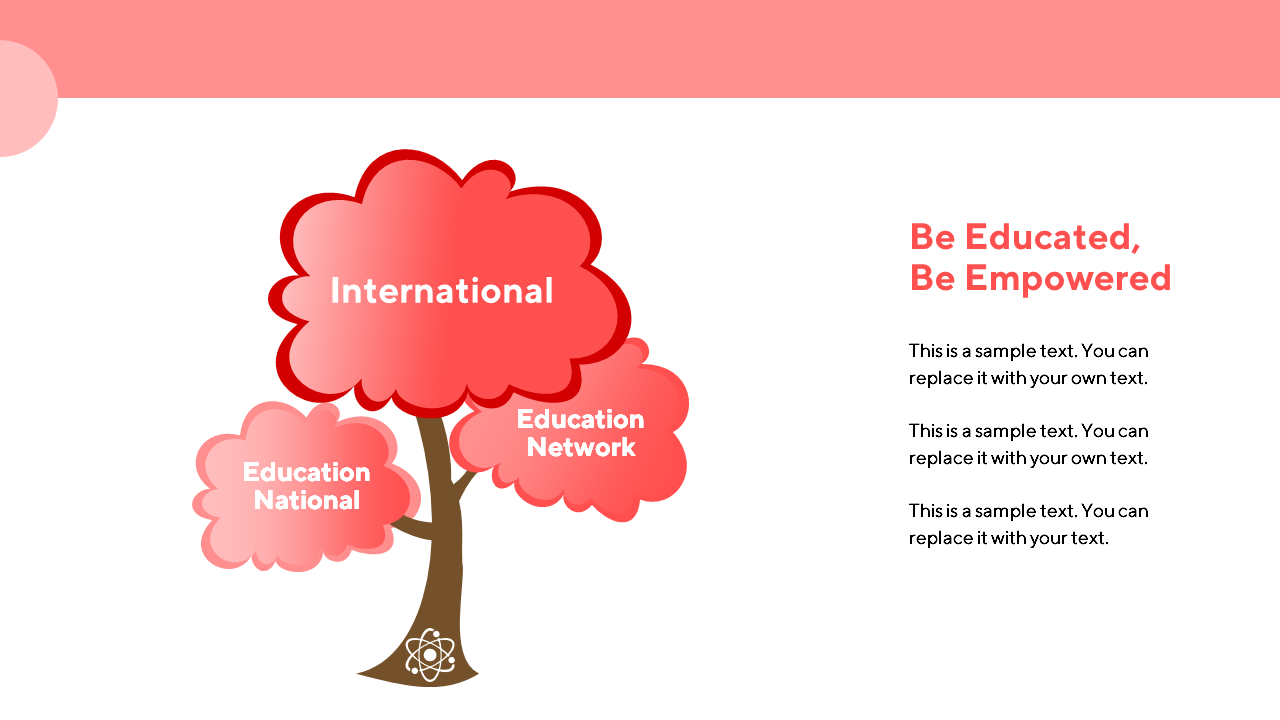
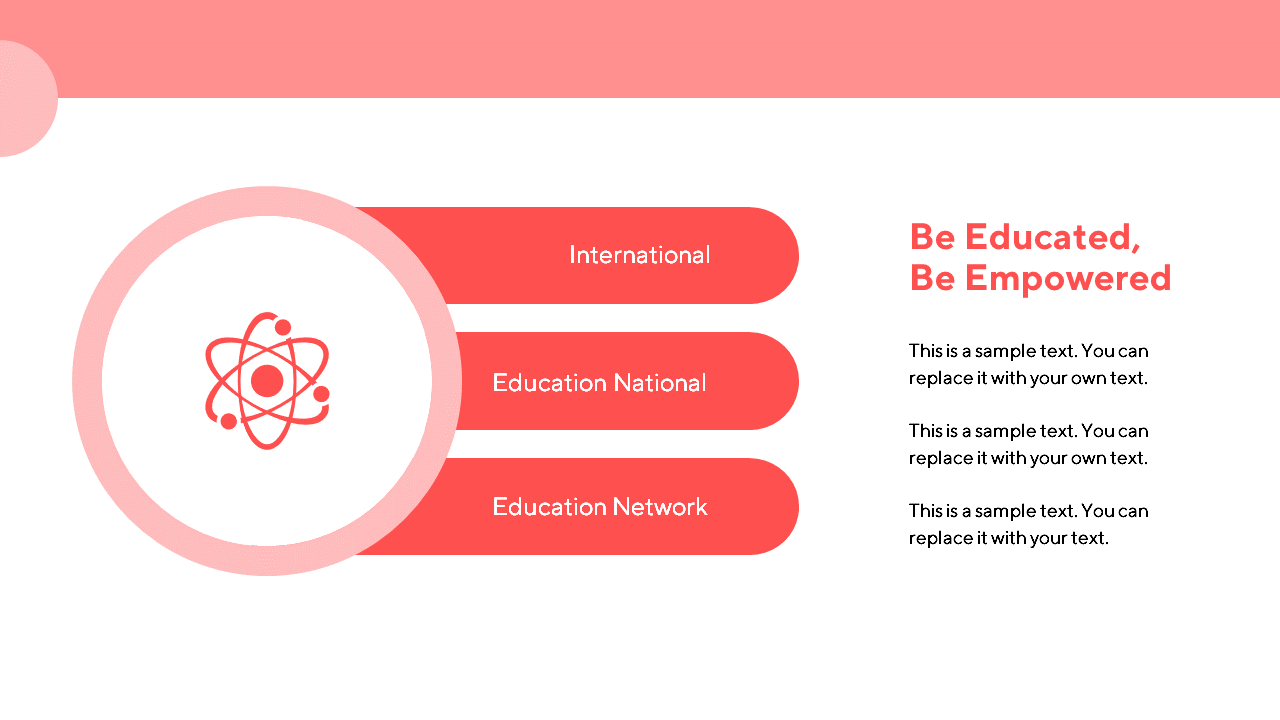
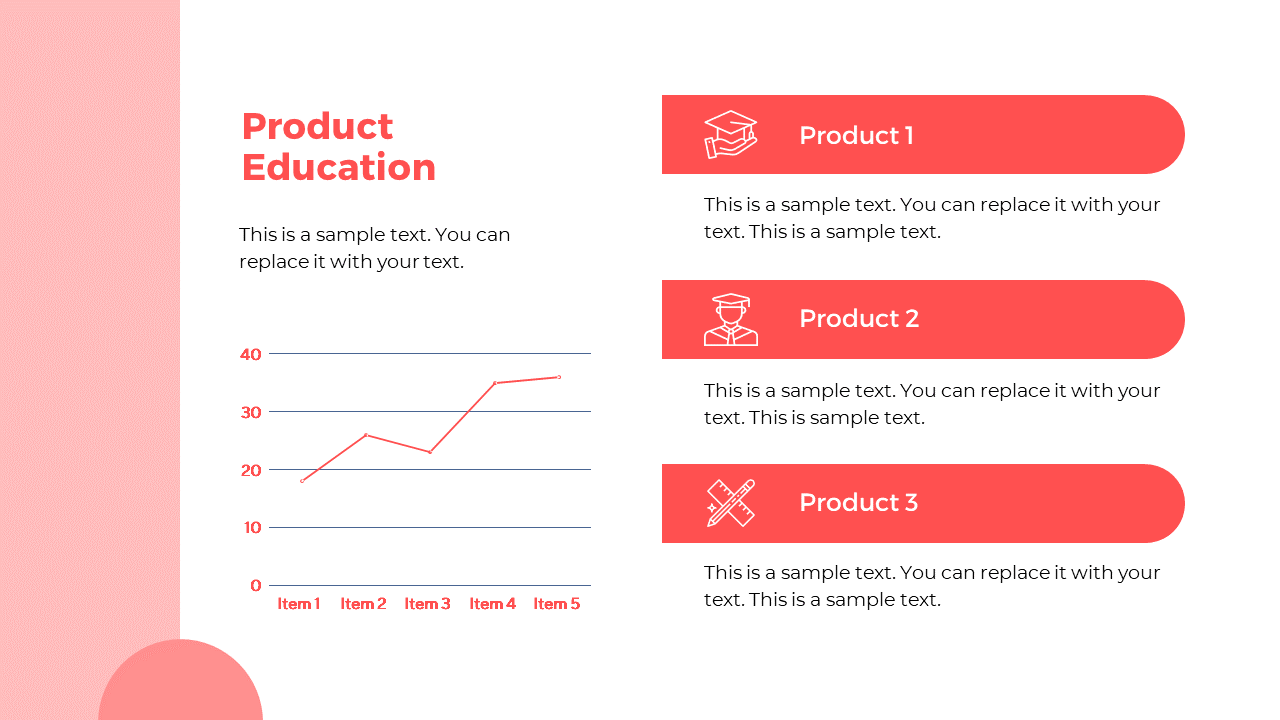
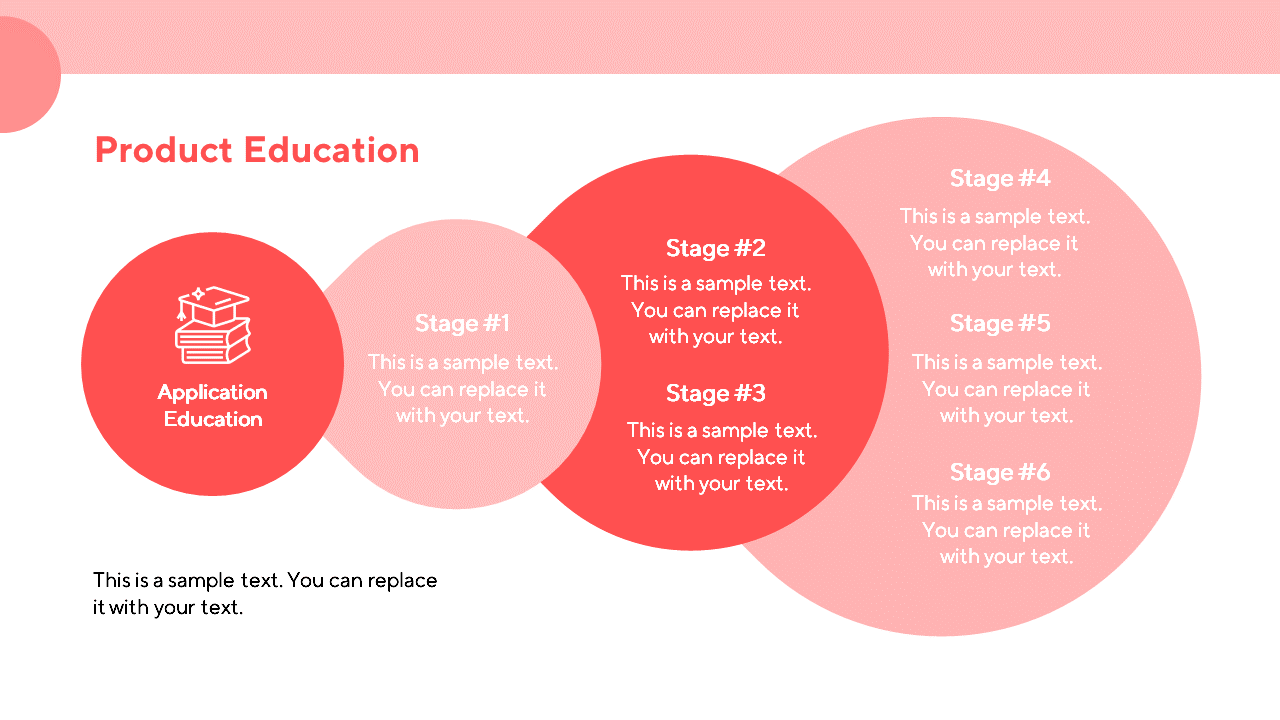
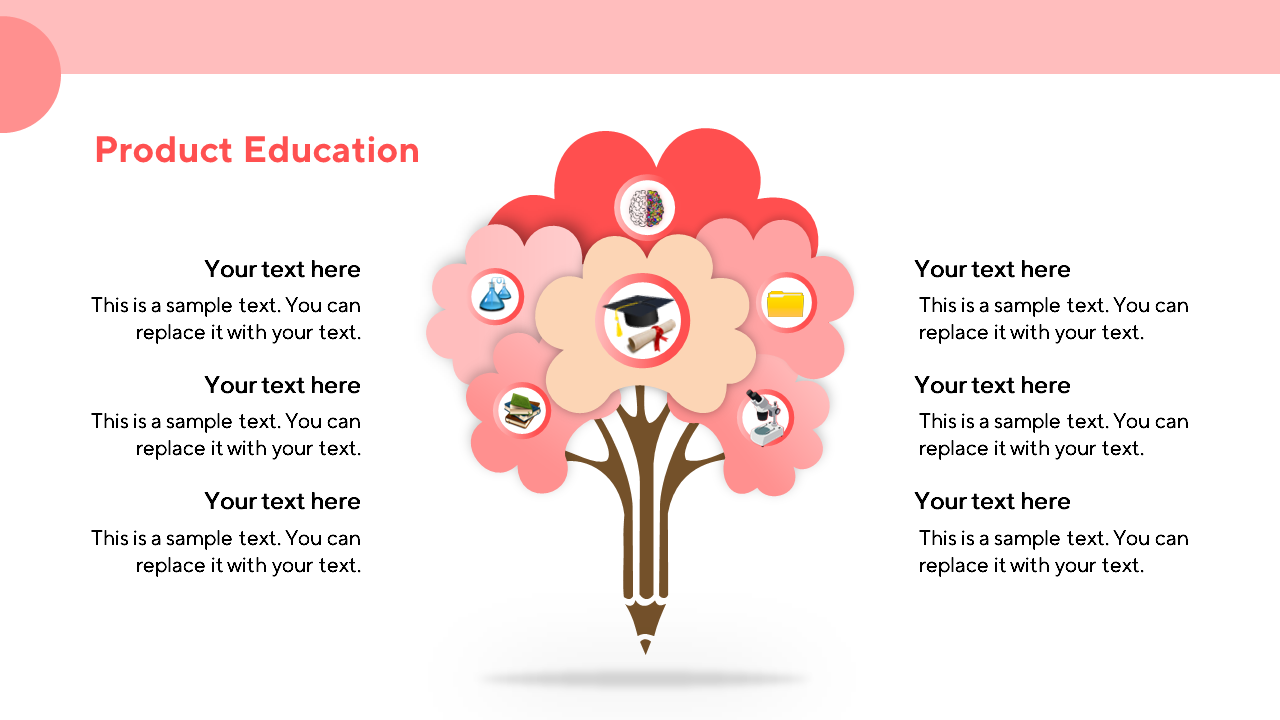
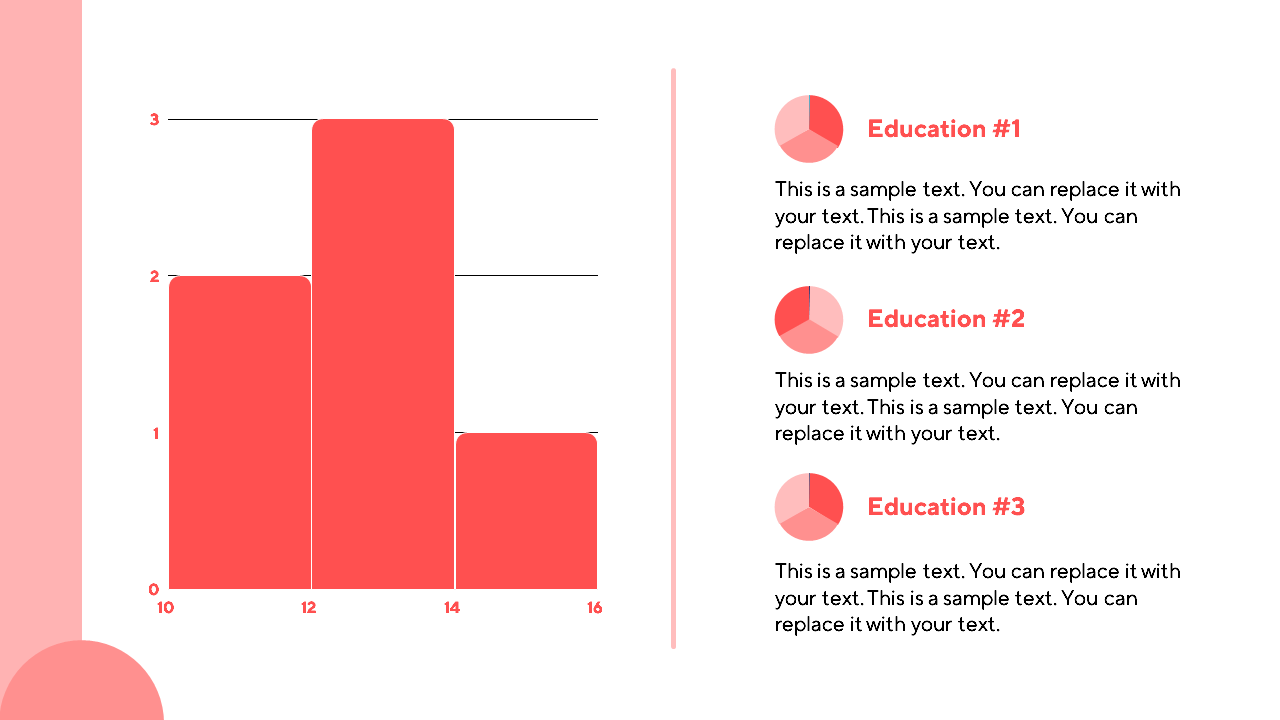
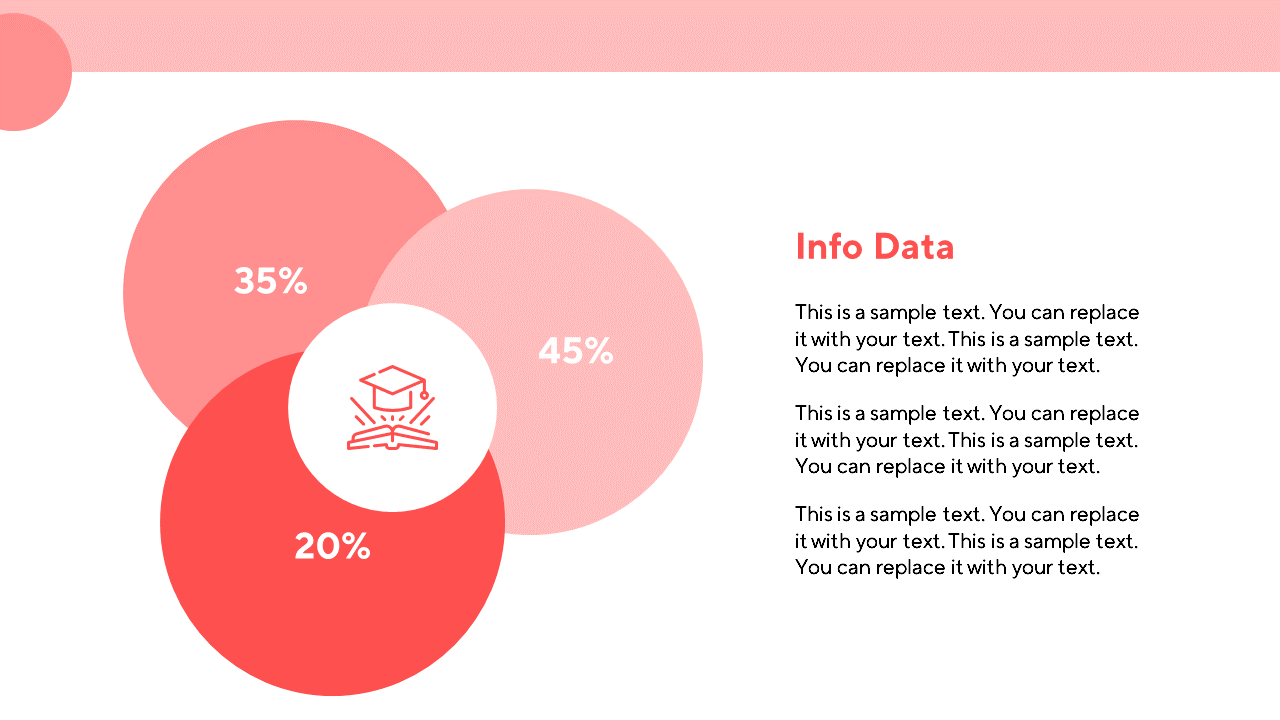
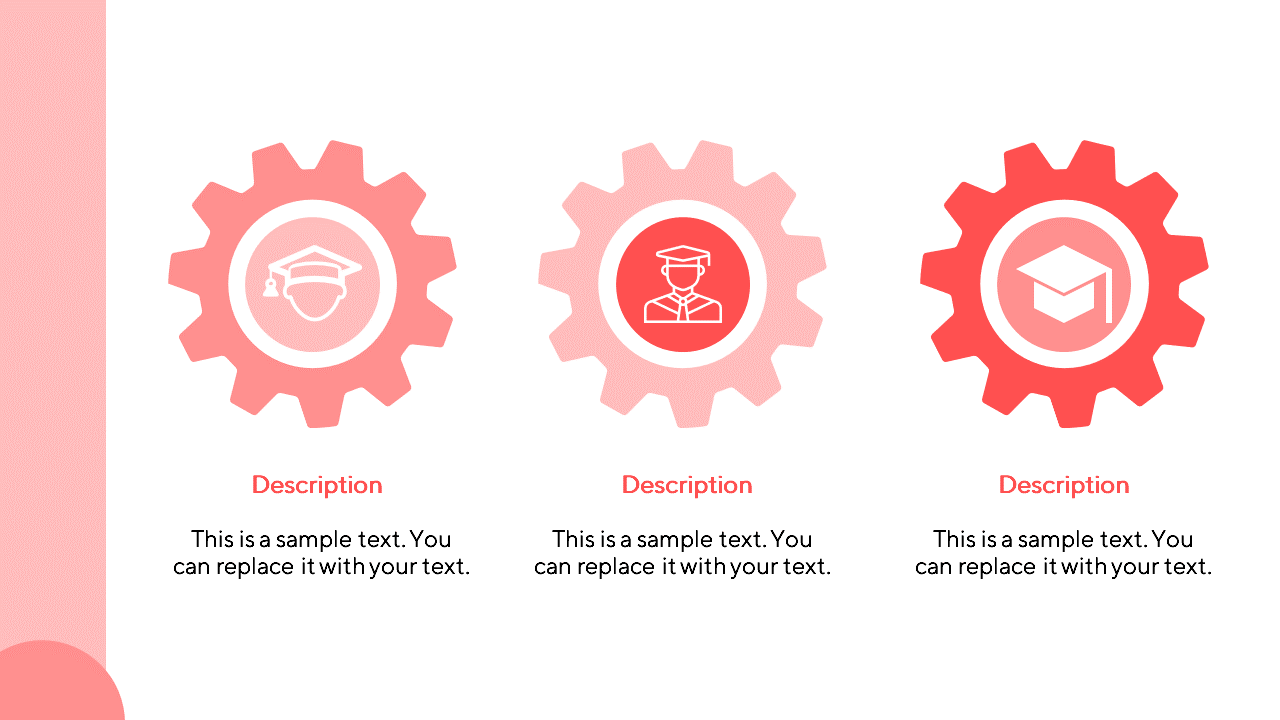
The education growth concept template consists of a tree diagram that is perfect for depicting growth. It has a beautiful design and allows users to visualize up to six elements.
Thanks to its education-oriented design, this PowerPoint template is a great choice for anyone making a presentation to students. For example, you can use this presentation template to show students the options available to them as they advance in their careers.
Additionally, our education PowerPoint templates can be used in business and financial presentations that are related to growth or investment. Our free PowerPoint templates for education presentations are fully editable and available in appealing background colors.
You can also use our free templates as an Apple Keynote or Google Slides theme.
Get Access Now
Education Growth Concept Template



Simple Pricing for Full Access
Unlock full access to the entire library for one low price.
Why Presenters Choose Simple Slides
It's simple. Access to the largest library of professionally designed infographics & slides, plus world-class training.

10,000+ Professional Presentation Templates
Optimized for use with PowerPoint, Google Slides & Keynote. Create presentations in minutes, not hours.

World-Class PowerPoint University
With our university, you'll learn how we make templates & deliver stunning presentations.

Easy to Edit
Use your favorite tool to edit your new slides. Compatible with PowerPoint, Google Slides & Keynote.
Popular Templates

Dark Infographics
Abstract's goal is to portray a visual representation through means of shapes, colors, lines, and patterns.
Strategy Infographics
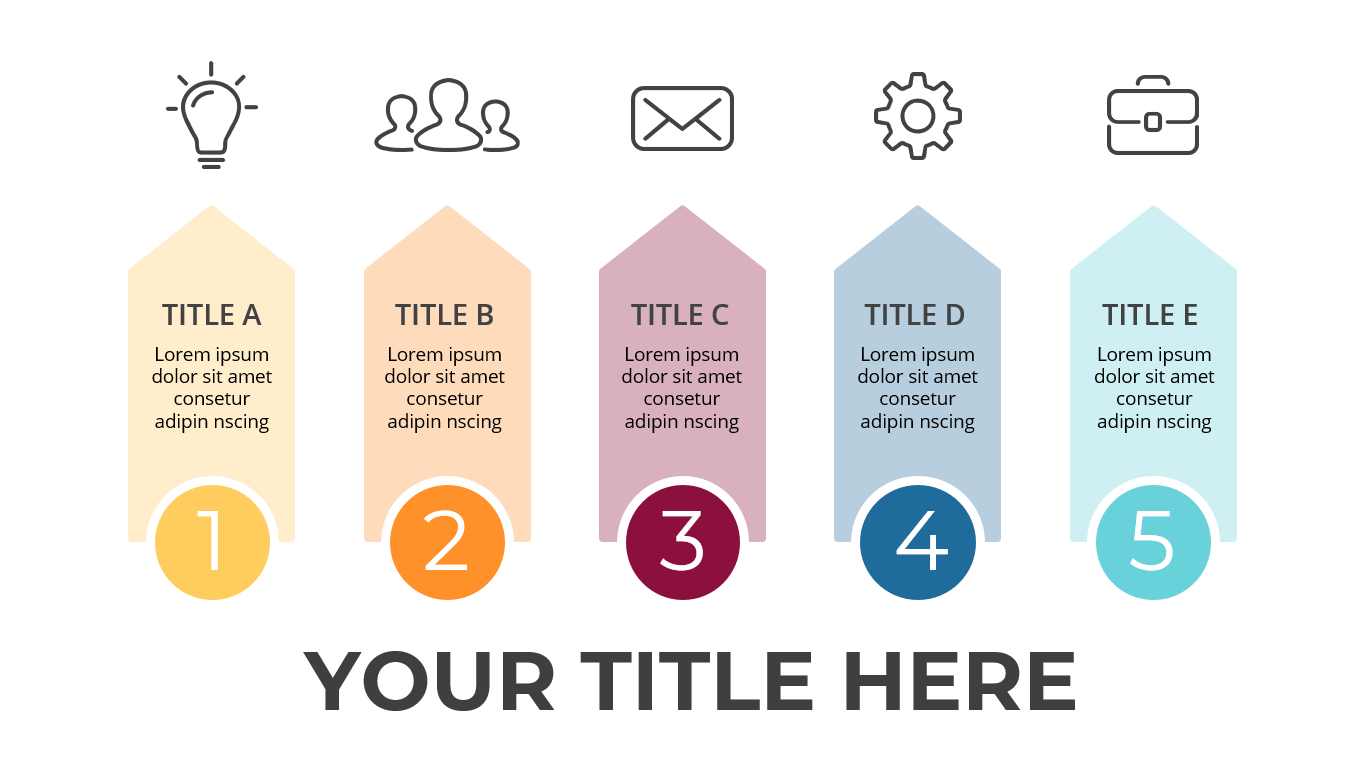
Customizable for any presentation, these templates are the perfect way to give your audience an up-close look at what you've got.

Diagrams Infographics
These infographics are spectacular in color and design. Every diagram has been hand crafted by our expert design team and is easily customizable to your presentation needs. These infographics are favorites in the business sector and do an excellent job visualizing stale data.


