How to Add Infographics in PowerPoint
May 28, 2023
Do you want to add an infographic to your PowerPoint presentations but don't know how?
Learn how to add infographics in PowerPoint to simplify complex data in your presentations. s
In this blog post, we will go through the following:
-
Create infographics for your PowerPoint presentation
-
Insert infographic templates in PowerPoint
-
Frequently asked questions about creating infographics in PowerPoint presentations
Create Infographics for Your PowerPoint Presentation
To create infographics for your PowerPoint, all you need to do is:
-
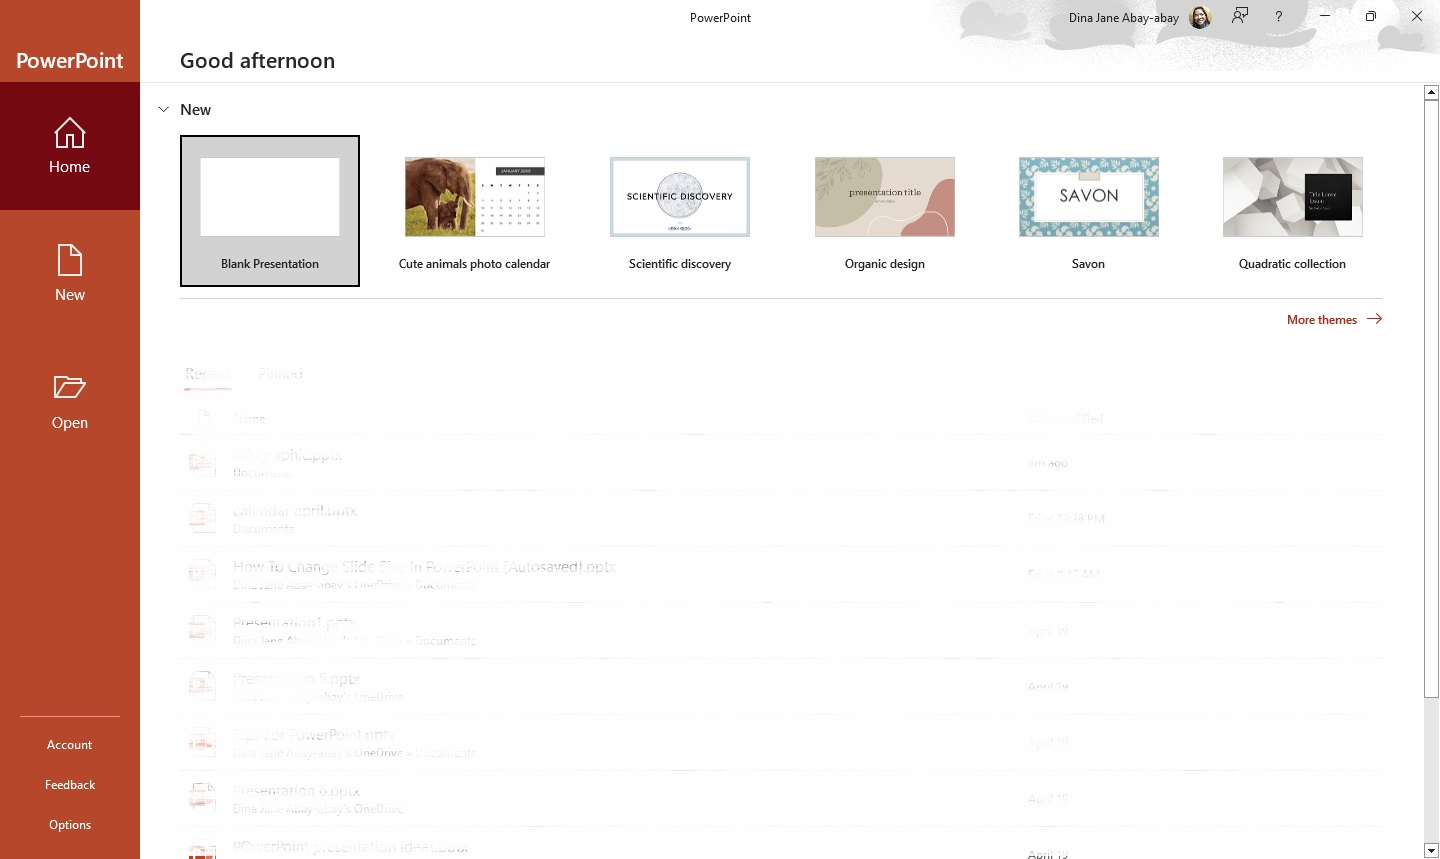
Open Microsoft PowerPoint on your computer.
-
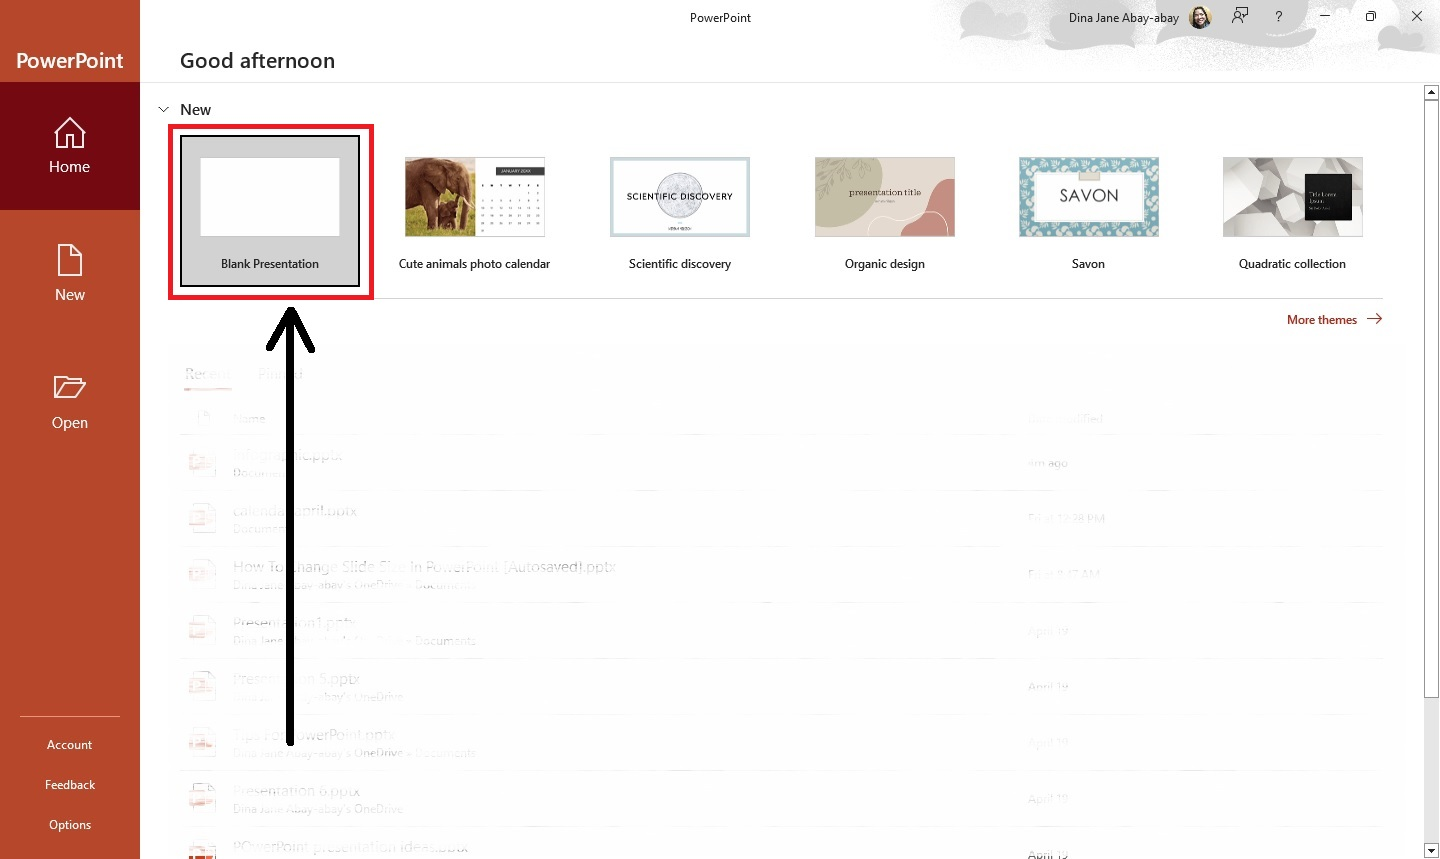
Select a blank presentation for your infographic template.
-
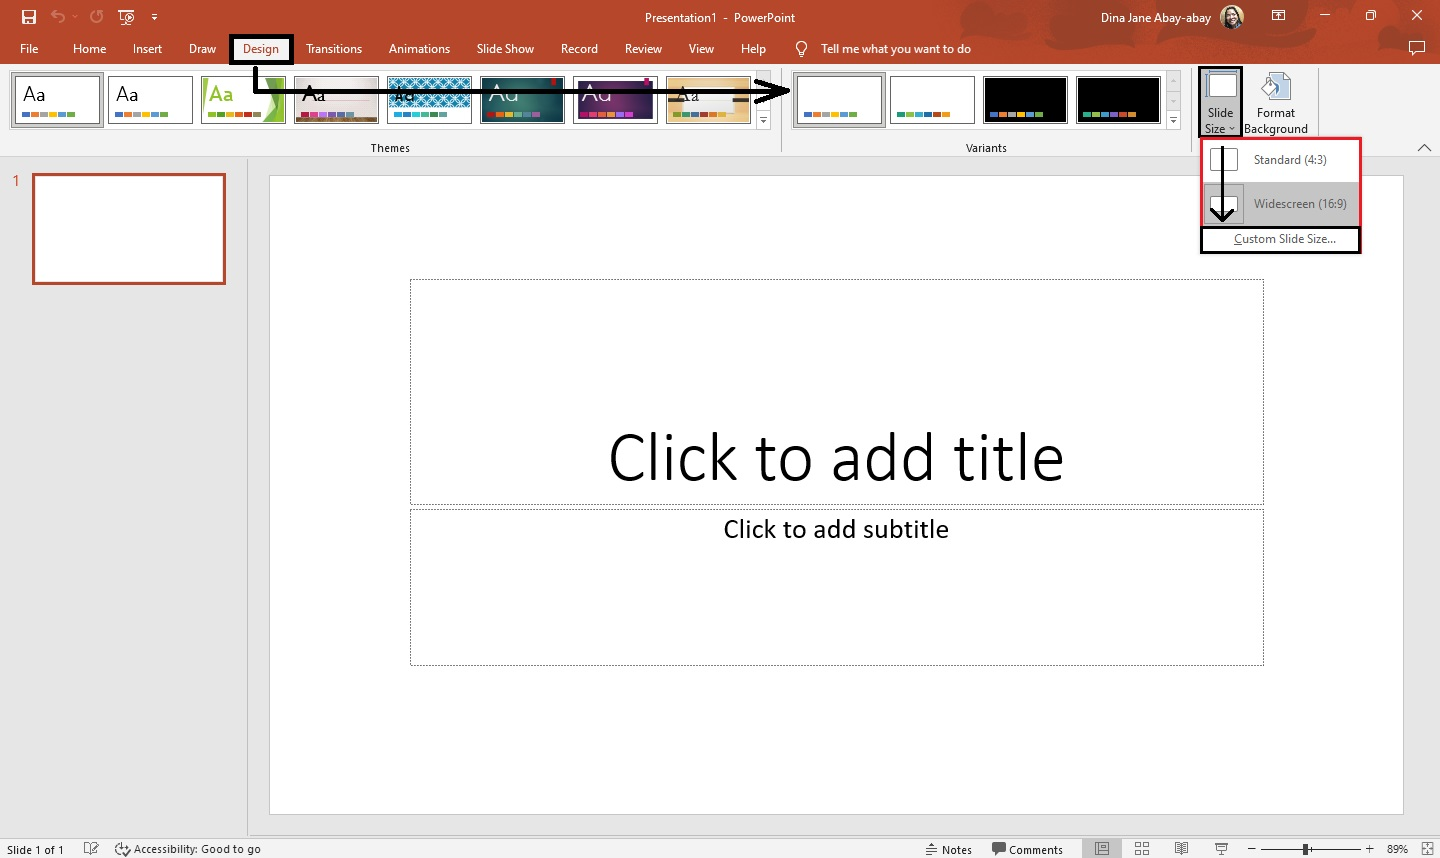
Go to the "Design" tab and select "Slide size" from the "Customize" section. Then, click "Custom Slide size" from the drop-down menu.
-
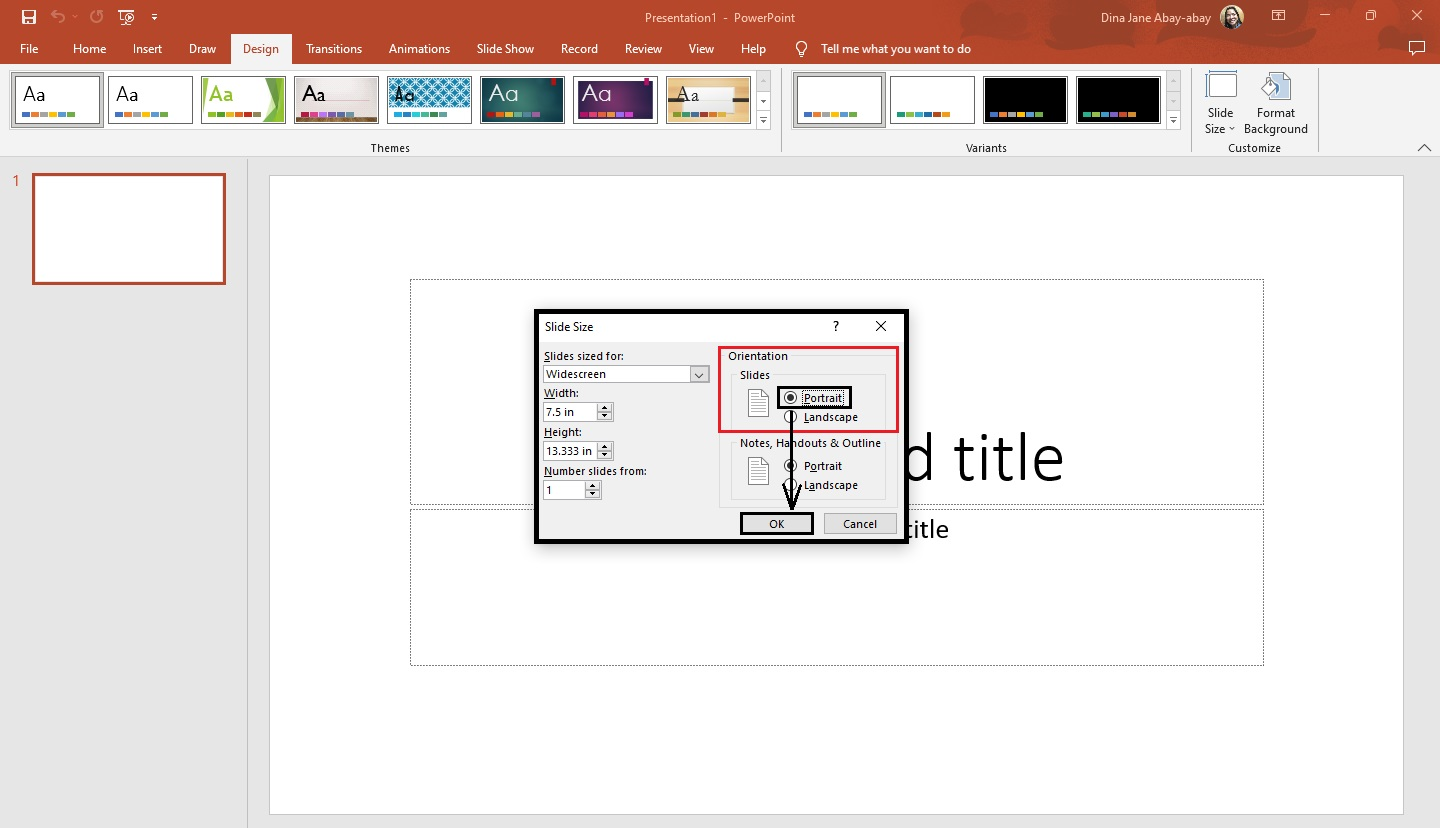
A dialog box for "Slide size" will appear. Select "Portrait" from the "Slides" section and click "Ok."
Change the background color of your infographic design
Presentation colors are important in communicating your message. To change the background color of your infographic design, you need to do the following steps:
-
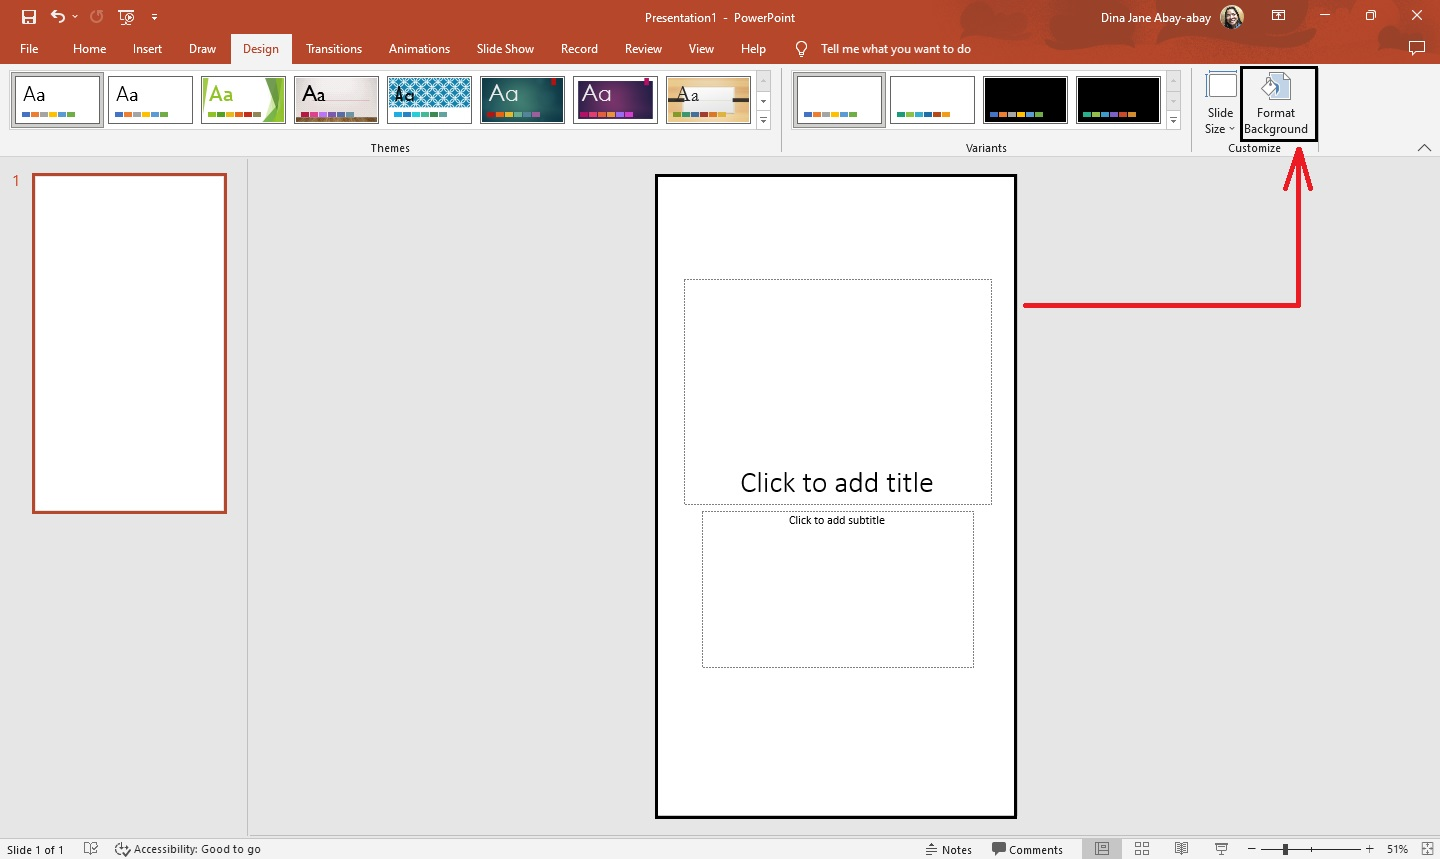
When your slide turns into "Portrait," go to the "Design" tab and select "Format Background."
-
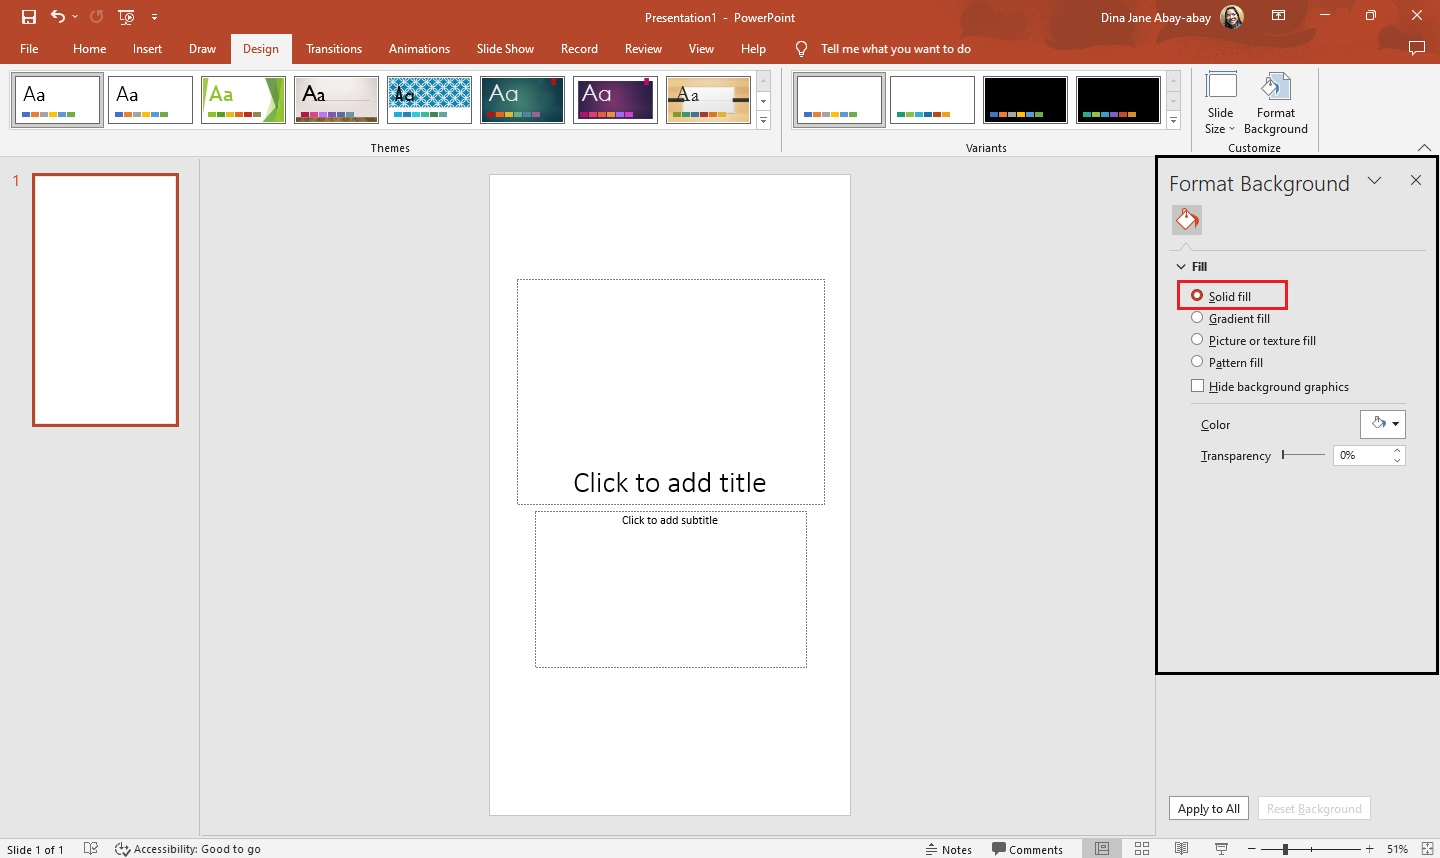
Click "Solid Fill" from the "Format Background" on the right side of your presentation.
-
Select "Color" and click a specific color you want to use for your infographic template.
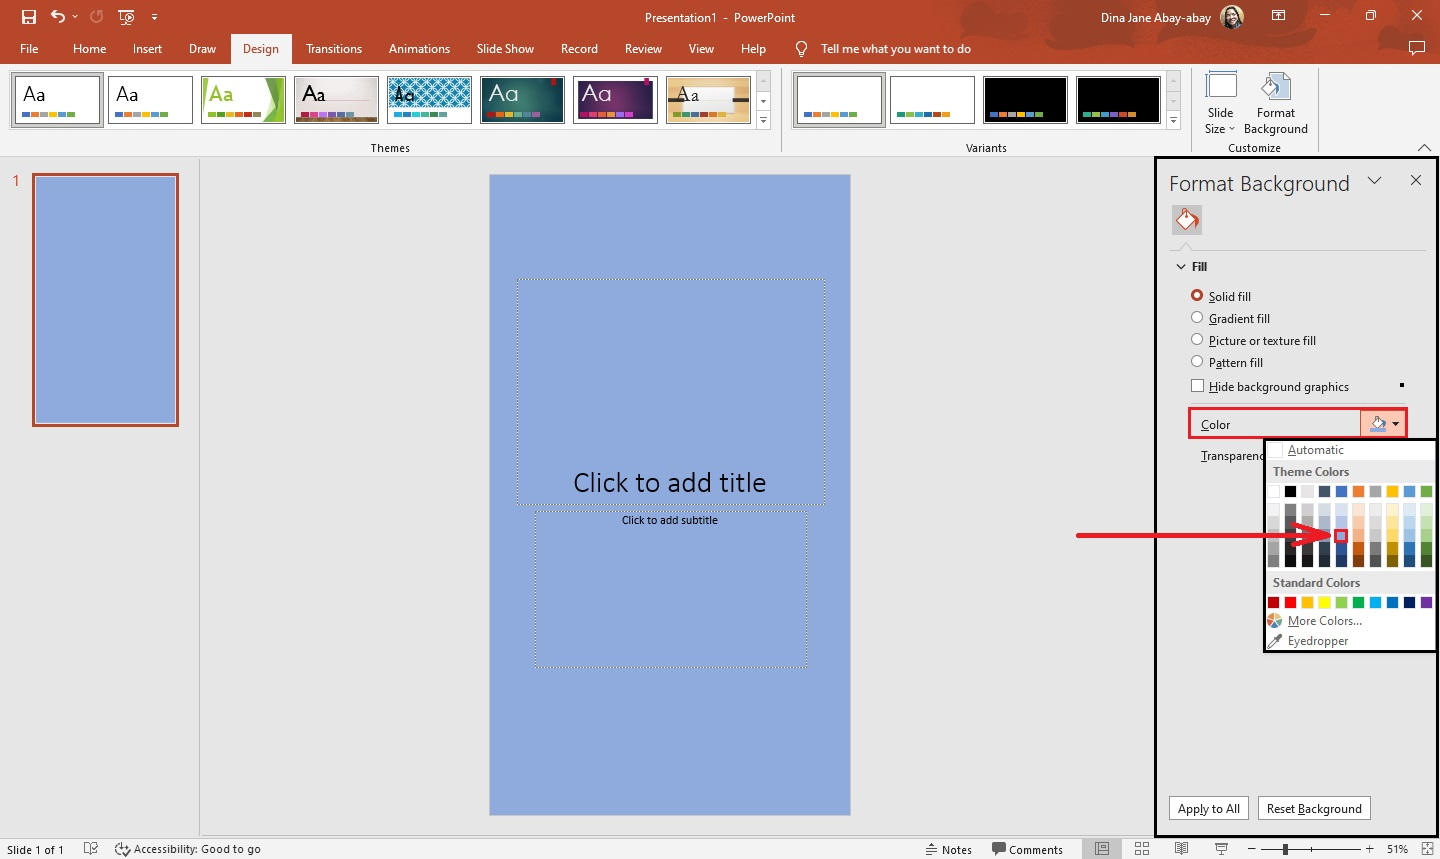
Note: You can also choose the "Gradient Fill," "Picture or texture fill," or "Pattern Fill."
Add text boxes, icons, shapes, and other visual elements for your infographics.
-
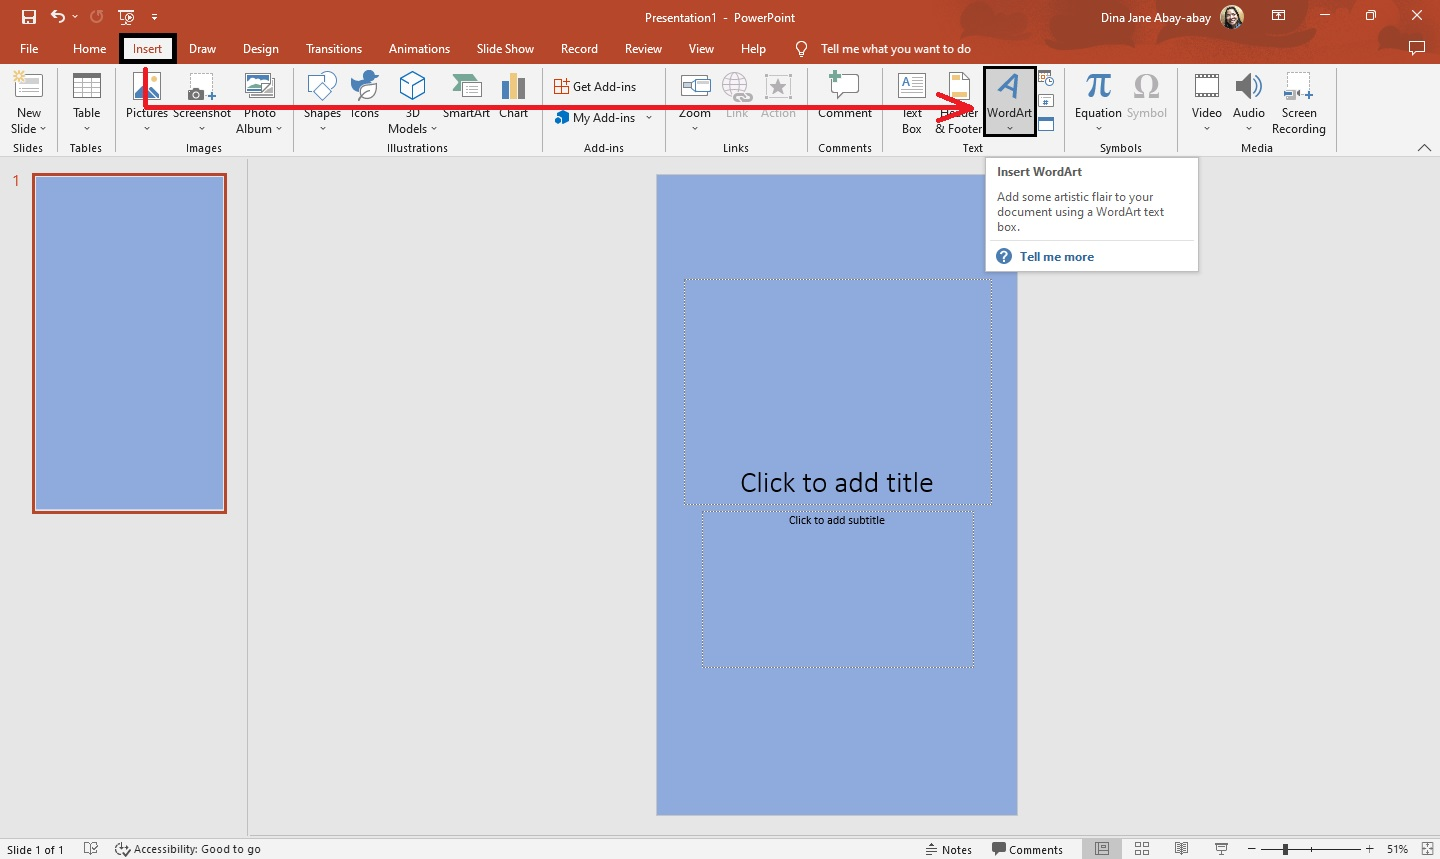
After creating an infographic slide, go to the "Insert" tab and click "WordArt" for your title.
-
Then, insert the icons and shape you want to use on your infographic template.
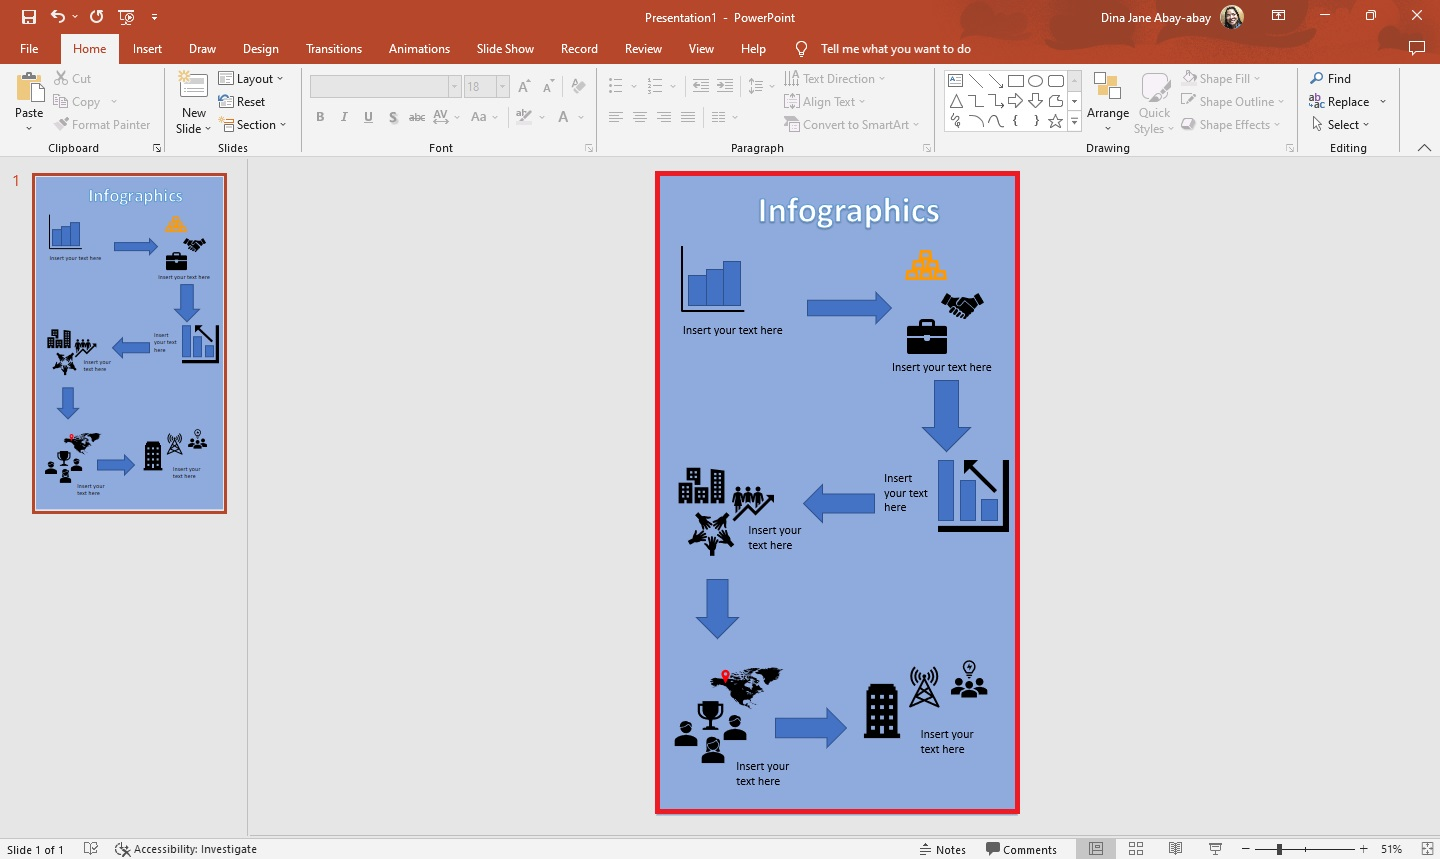
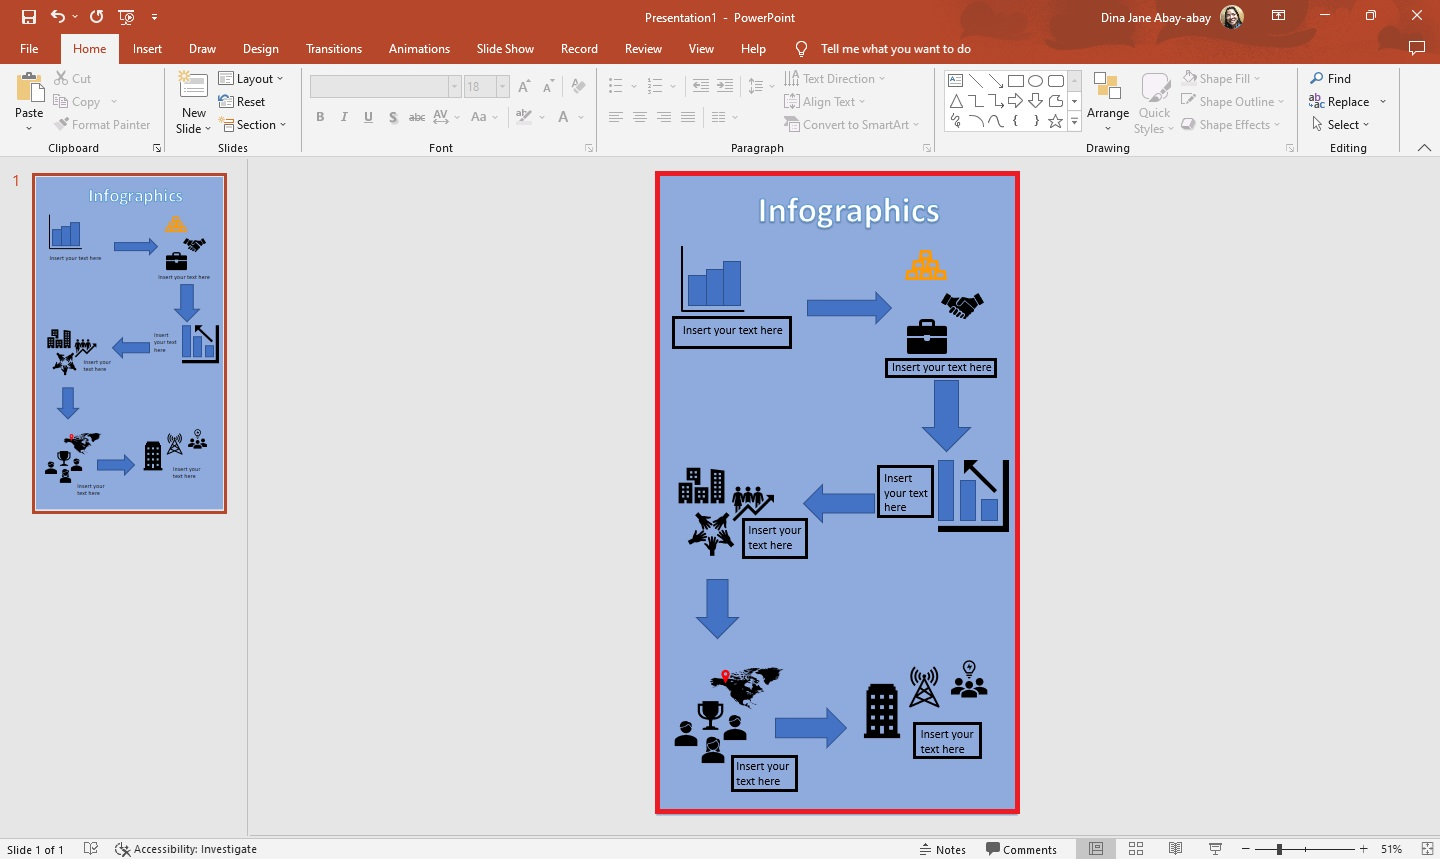
After you've put all the icons and text boxes, you have created PowerPoint infographics.
Custom icons from infographic slide
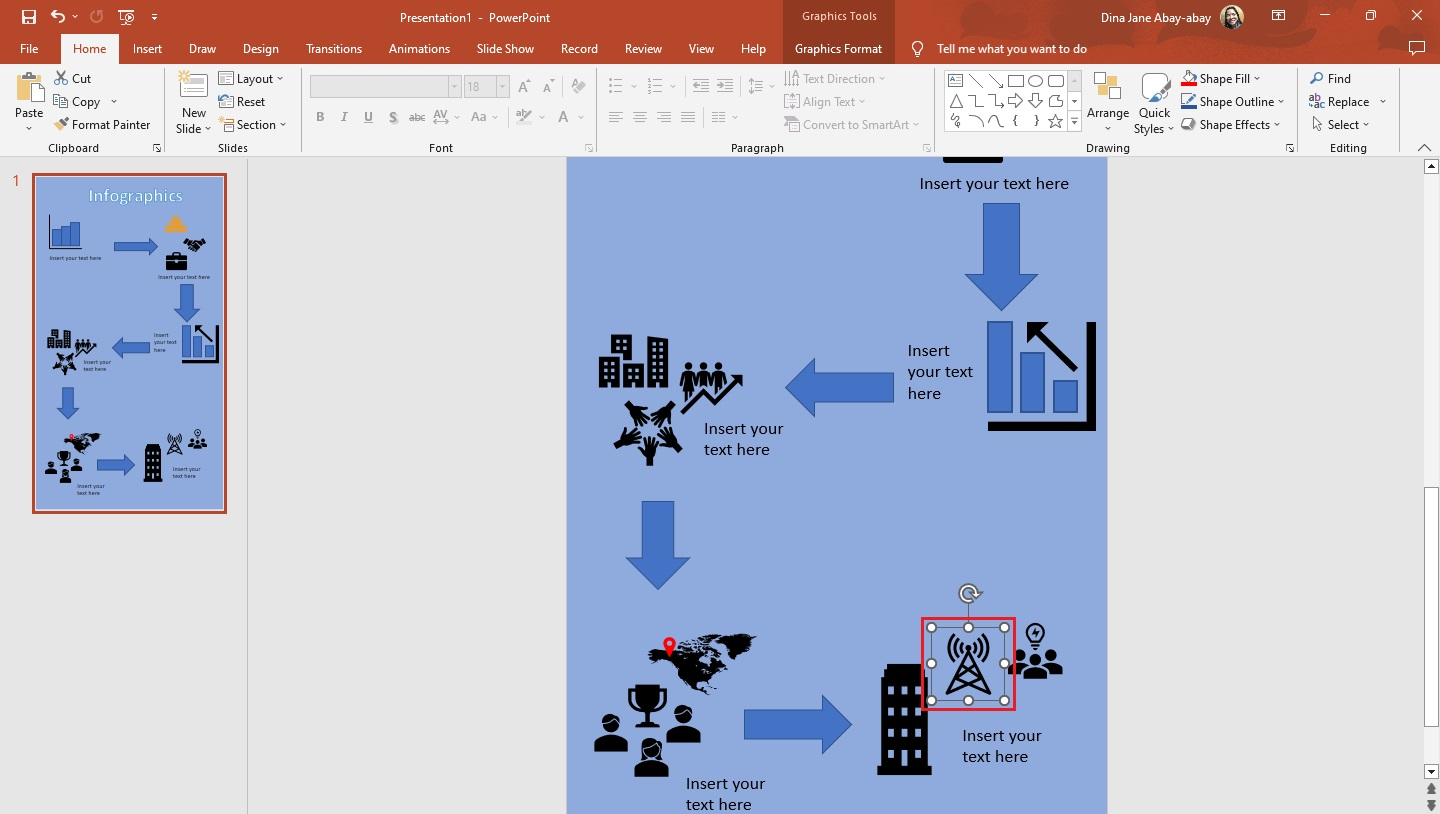
To customize the inserted icons on your infographic slide, follow these steps:
-
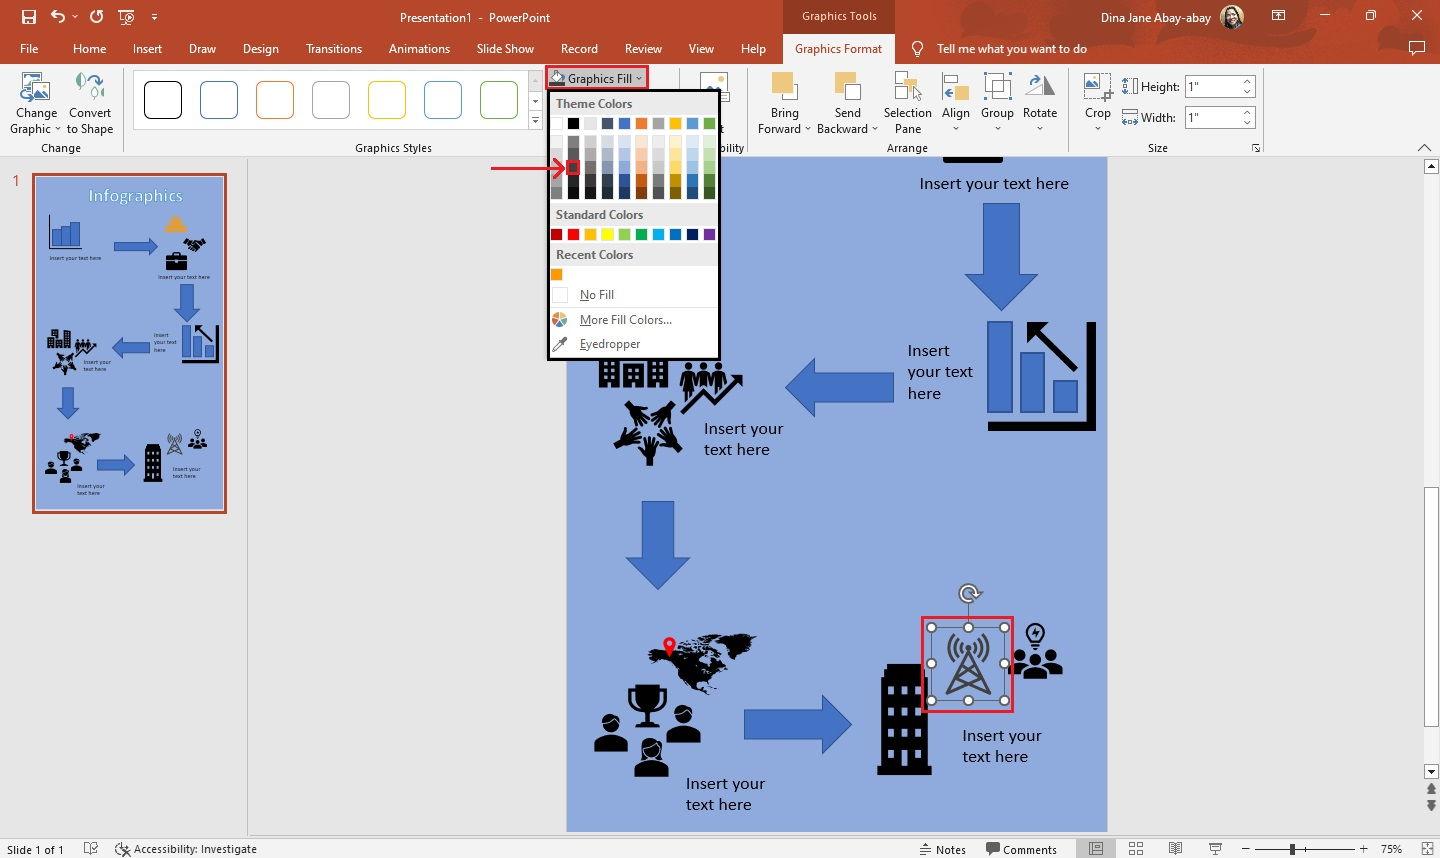
Select the specific insert icons on your presentation slide and click the "Graphic Format" tab.
-
From the "Graphic Styles" section, click "Graphic Fill" and choose a desired color for your icon.
-
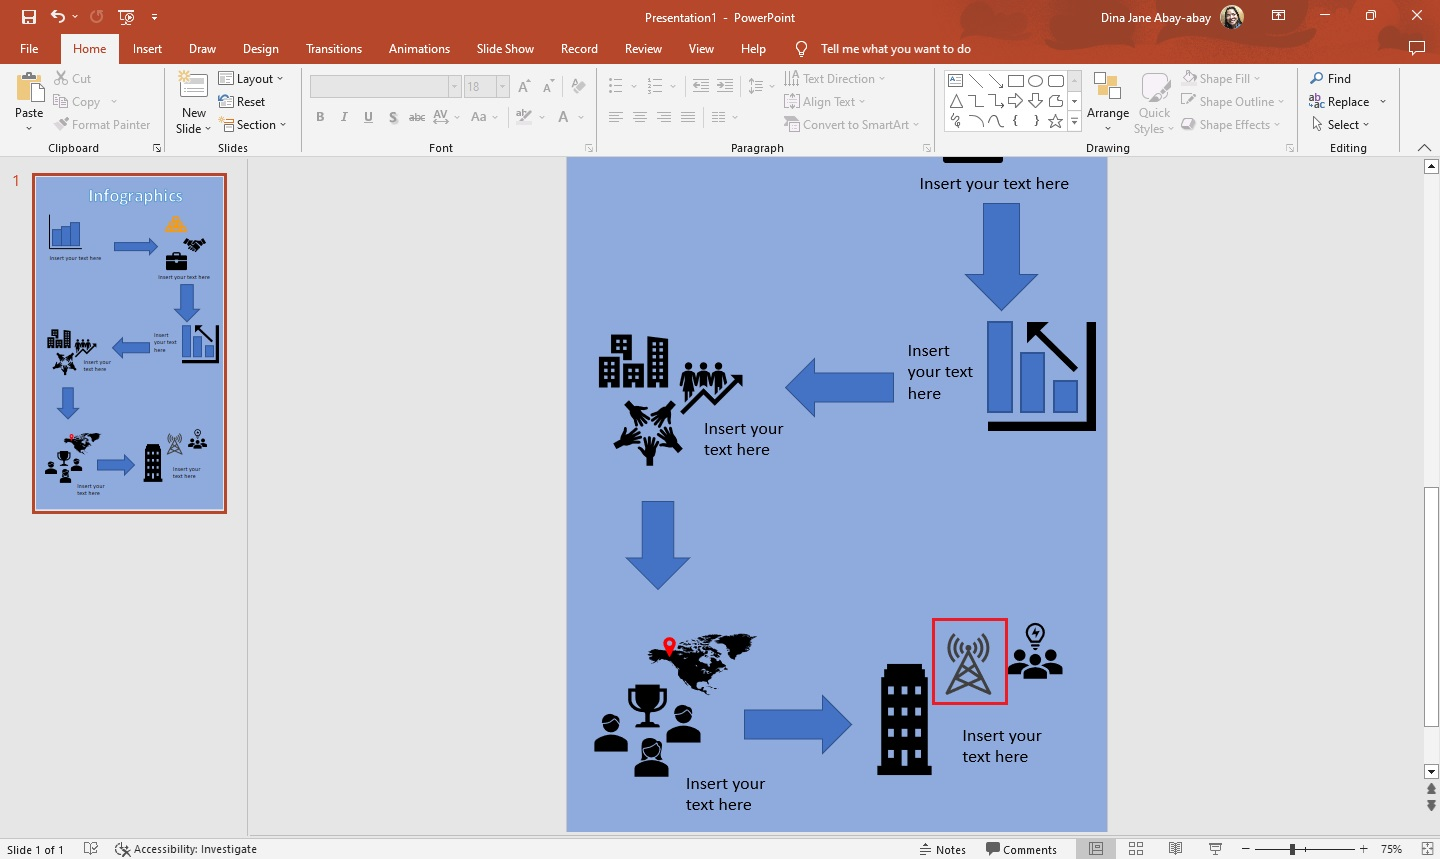
Once you click it, the fill color on your icon will change according to that hue.
Insert Infographic Templates in PowerPoint
Suppose you're using a PowerPoint infographics template from Simple Slides and want to insert them. All you need to do is:
-
Download the infographic templates you want to use on your specific PowerPoint slide.
-
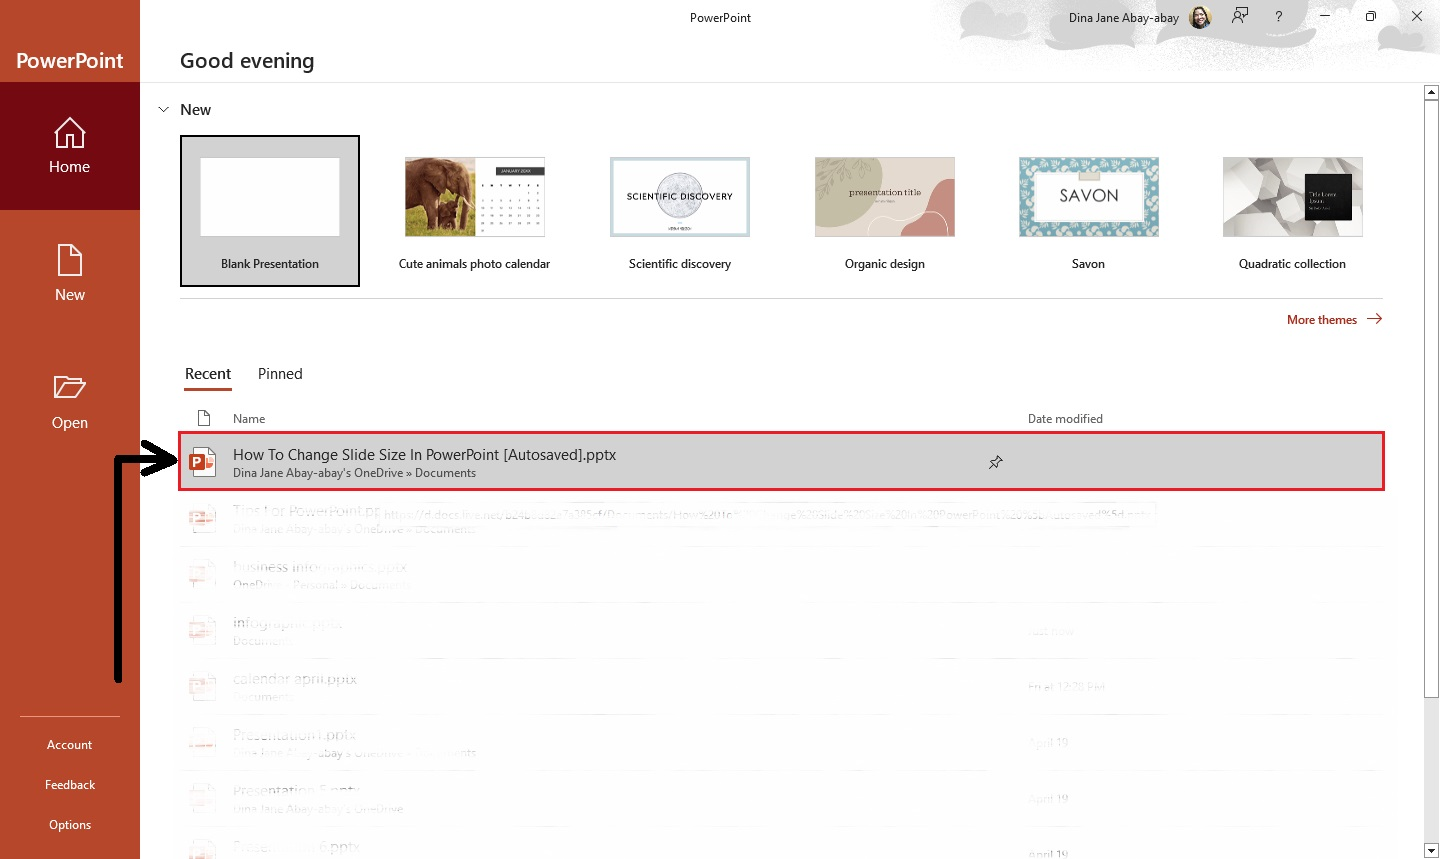
Open the existing presentation.
-
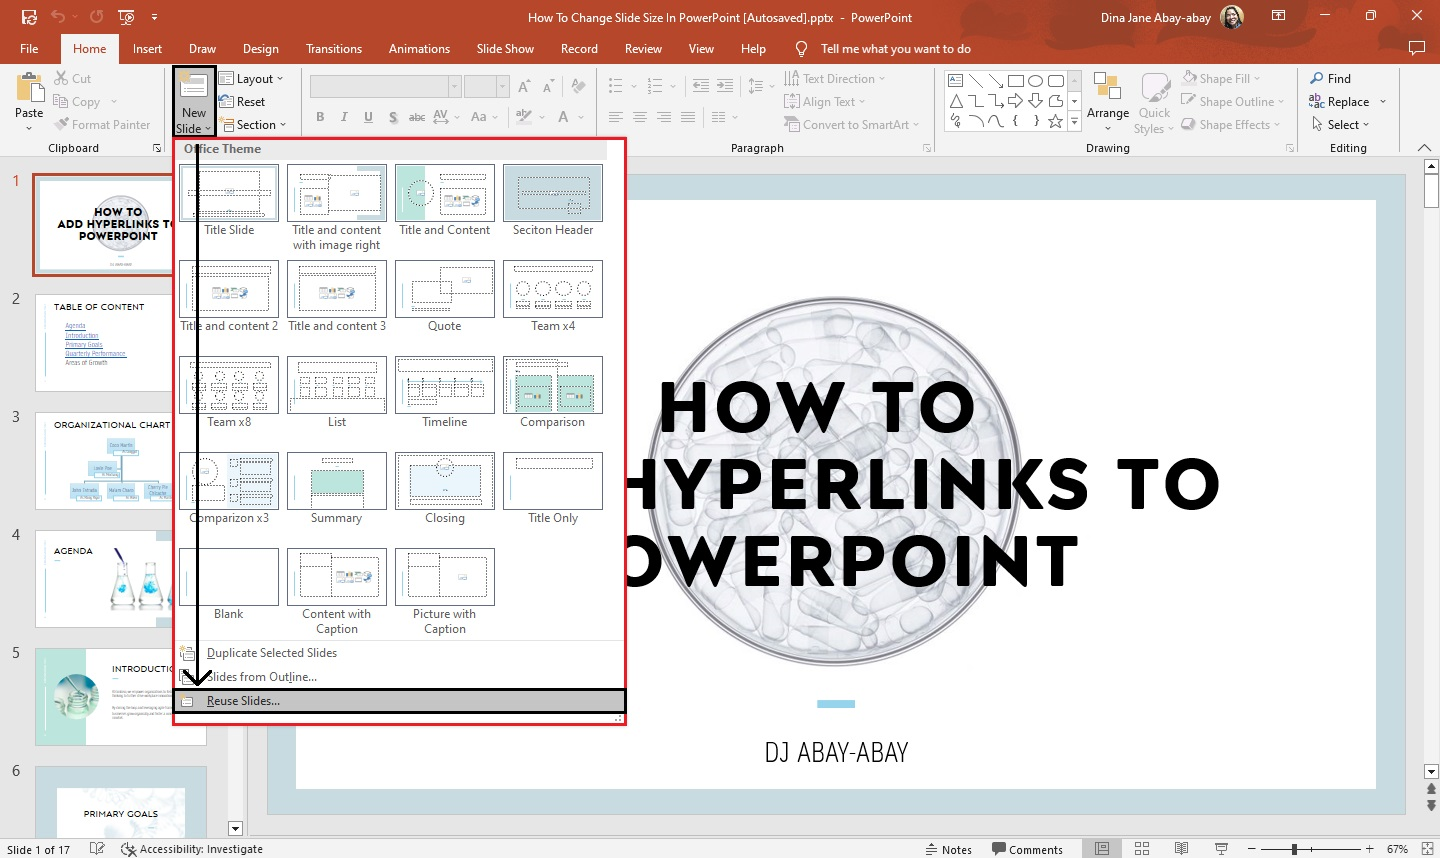
Click the "New slide" drop-down button and select "Reuse slides."
-
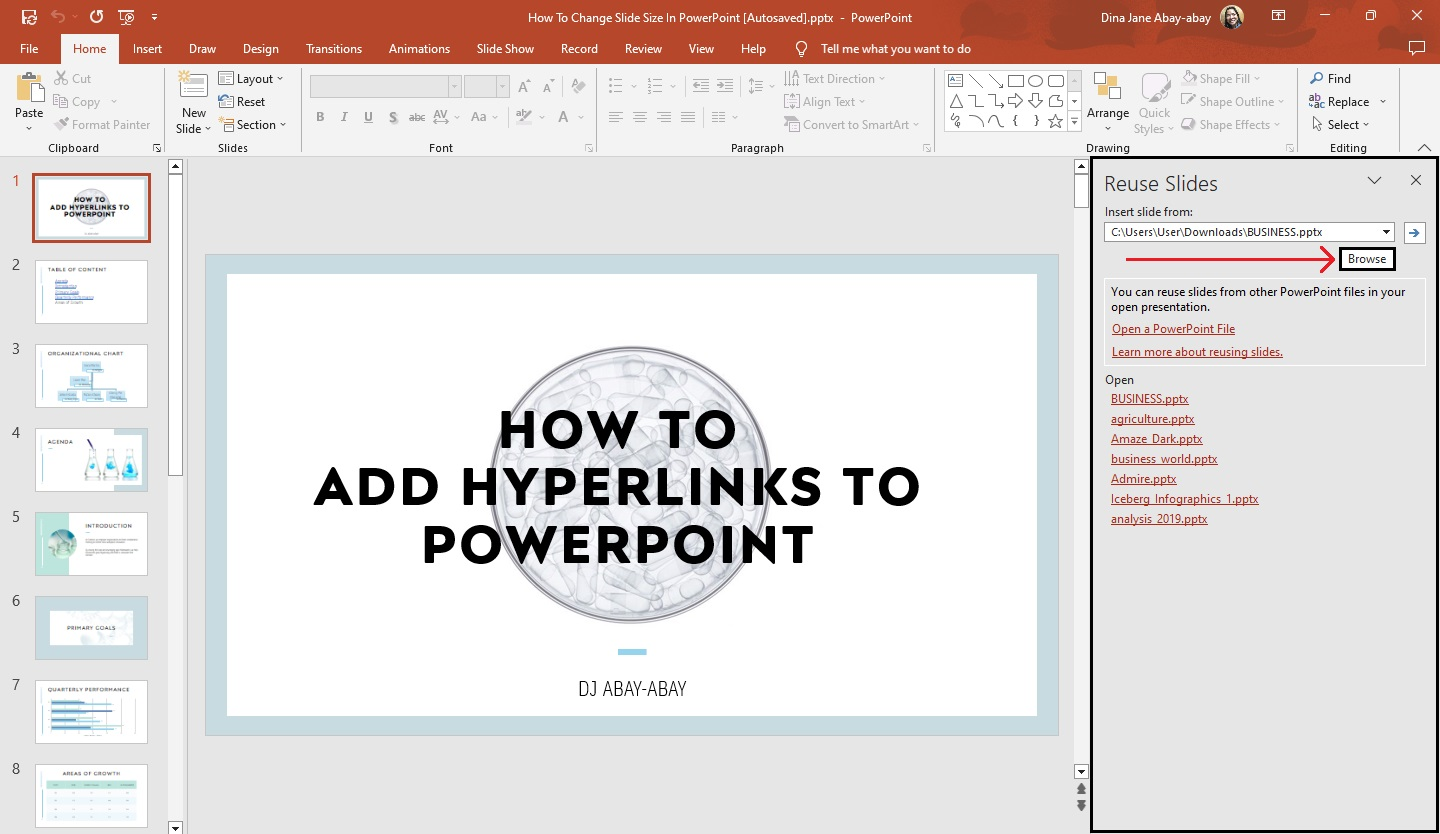
When the "Reuse Slides" pane appears on the right side of your presentation, click "Browse."
-
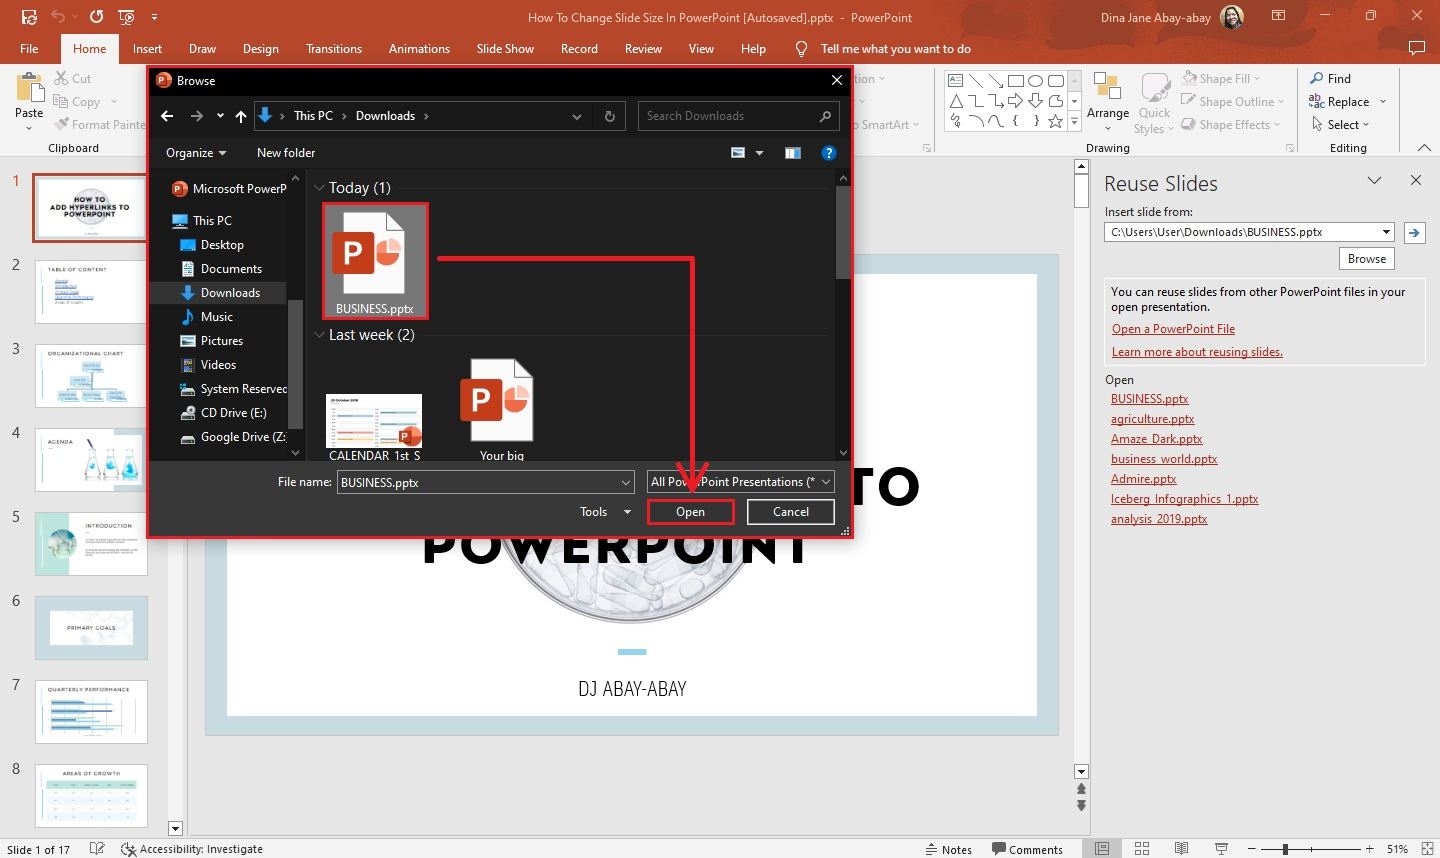
Once File Explorer opens, click the downloaded infographic template you saved.
-
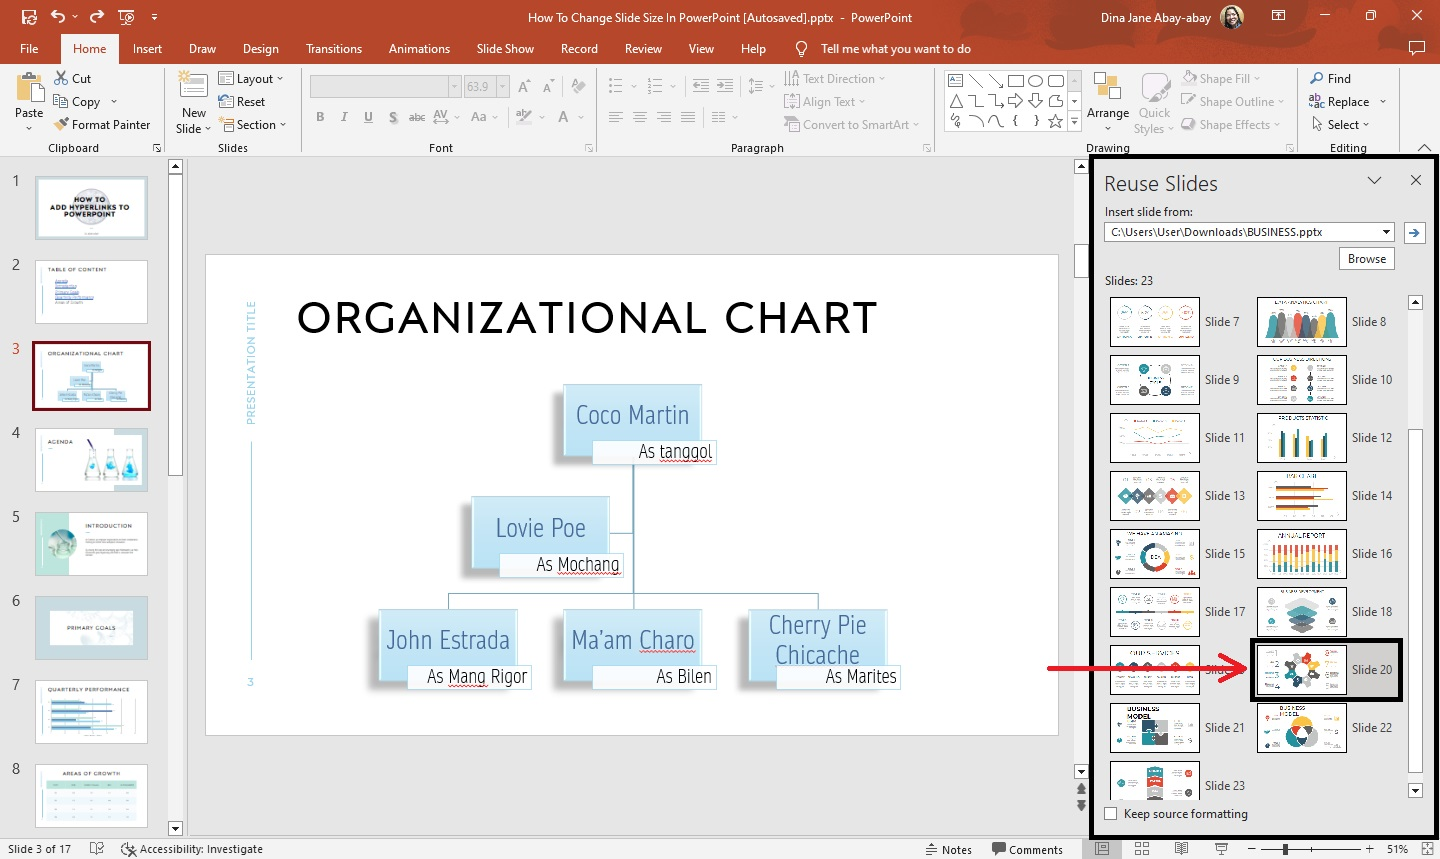
Select a specific infographic you want to use when all the templates appear in the "Reuse Slides" pane.
-
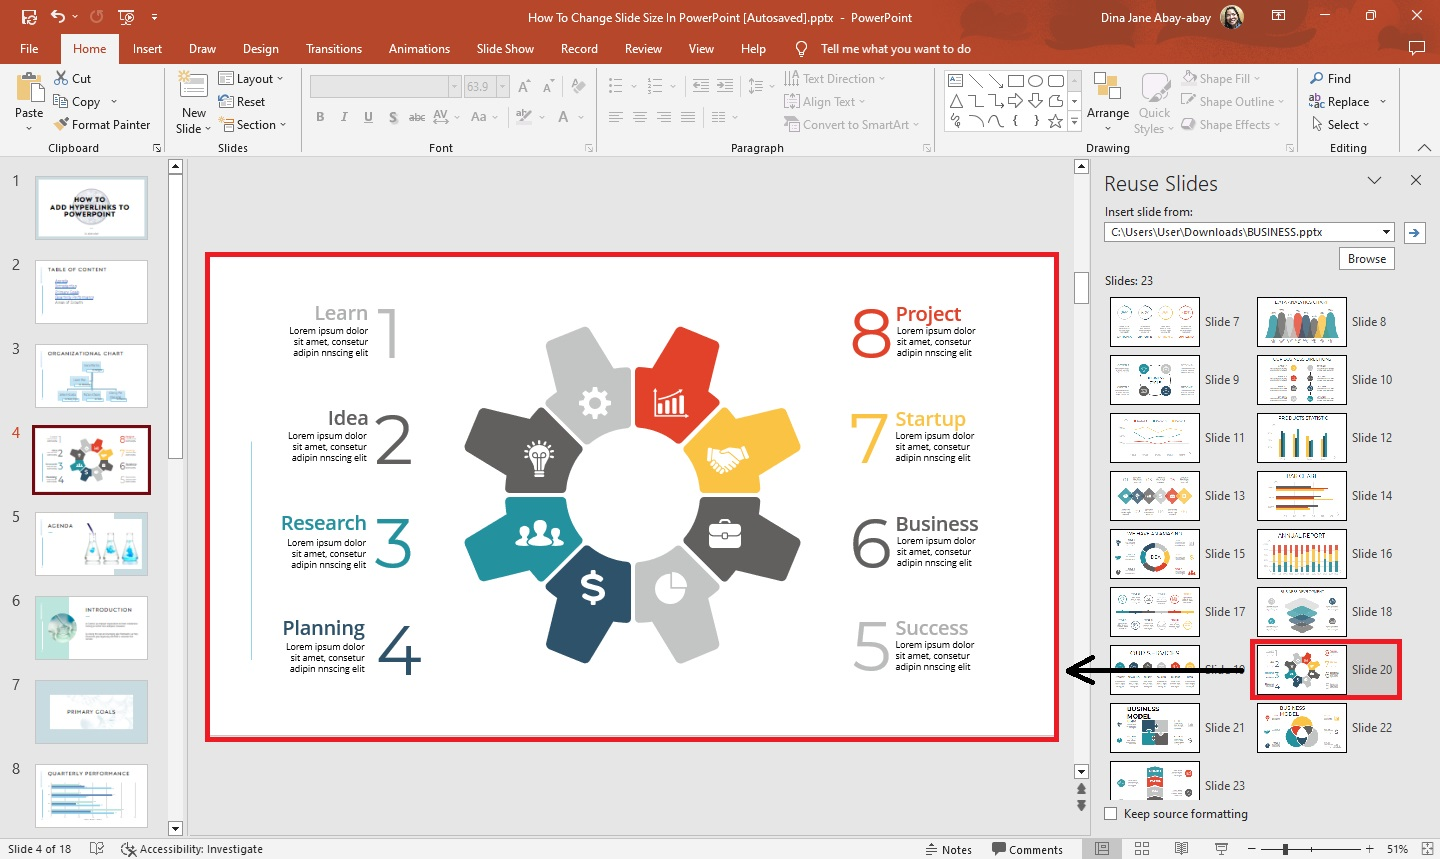
After you select it, it will automatically display on your slide.
Use infographic templates from the SmartArt feature of PowerPoint
Use Microsoft PowerPoint's SmartArt feature to add charts and diagrams as visual components to your business presentation.
Quick Tip: Check out our guide on how to use SmartArt in PowerPoint.
Use Modern Infographic Design from Simple Slides
Are you looking for perfect data infographics for your presentation slide? Visit Simple Slides and access over 10,000 templates, slides, and infographics for your presentation.
Final Thoughts on Creating Infographics in PowerPoint
Adding a PowerPoint infographic can elevate your presentation. You can simplify data presentation and keep people engaged throughout your speech.
Check out our Simple Slides YouTube channel to watch our presentation video tutorials.
Frequently Asked Questions About Creating Infographics in PowerPoint Presentations:
What are the seven types of infographics?
Here are the common types of infographics based on their uses:
-
Data visualization
-
Naming timeline infographic
-
Process and how-to instruction
-
Comparison
-
Lists
-
Maps
What are the elements of an infographic?
The five elements of infographics are:
-
Data
-
Copy
-
Story
-
Design
-
Graphs or Charts
What is the basic goal of an infographic?
Infographics can help people understand complex concepts using visual aids.
Related Articles:
How to Add Music to PowerPoint
How to Set Microsoft PowerPoint Themes in 4 Easy Steps
How to Remove Animation From PowerPoint Presentations
Get A Free Sample of Our Award-Winning PowerPoint Templates + University
Get A Free Sample of Our Award-Winning PowerPoint Templates + University
Join our mailing list to receive the latest news and updates from our team.
Don't worry, your information will not be shared.
We hate SPAM. We will never sell your information, for any reason.


